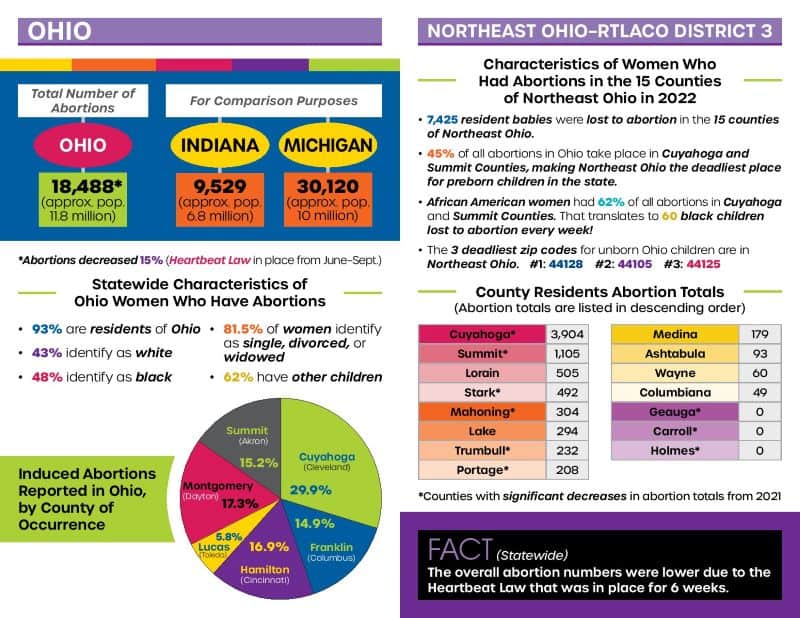
Ohio has kept statistics on abortions since 1976, several years after the landmark Supreme Court ruling allowing women legal access to abortion. Since 2004 Ohio has published an Annual Abortion Report, which is a comprehensive and very detailed report based on confidential abortion reports given to women by the Department of Health at the time of their procedure. It provides ample information on such details as who is having abortions, where they are occurring, which trimester the abortion is performed, what type of abortion is given, and additional data. When we study and compare the individual reports over the last fifteen years, we can garner empirical evidence that gives insight into abortion trends occurring in the state.
(Note that last year’s statistics are taken from the Annual Induced Abortions in Ohio Reports) Induced Abortions in Ohio , Ohio Department of Health, September 2020, file:///C:/Users/sharo/Desktop/2019%20Ohio%20Abortion%20Report.pdf
Other statistics used for comparison are taken from reports from 2004-2018: https://odh.ohio.gov/wps/portal/gov/odh/explore-data-and-stats/published-reports/data-and-stats-abortion-reports
United States Census Bureau, Quick Facts, Ohio: https://www.census.gov/quickfacts/OH
For the purpose of this writing, I am particularly looking at data from the last fifteen Annual Abortion Reports (2004 to 2018) to determine several things:
- Are the number of abortions in Ohio increasing or decreasing?
- Do abortion numbers in Ohio and its largest counties correspond with state and county population changes?
- In which counties are most abortions being performed, and are there increases or decreases in the number of abortions in these sites?
- Are we seeing growth in chemical abortions in favor of surgical abortions?
- Are second and third trimester abortions on the rise?


